Let’s start with a simple exercise. Suppose we have a three-on-three game, where there are five players on each team. If the game results in Team A defeating Team B by a score of 54 – 53; how can we determine each player’s contribution?
We will identify the players as A1, A2, A3, A4, and A5 for Team A, and B1, B2, B3, B4, and B5 for Team B. For insight, suppose that each rotation comes out as follows:
- A1, A2, A3 vs. B1, B2, B3 resulted in 11-5 over 15 possessions
- A1, A2, A3 vs. B1, B2, B4 resulted in 2-4 over 8 possessions; current score 13 – 9
- A1, A4, A5 vs. B1, B4, B5 resulted in 7-1 over 10 possessions; current score 20 – 10
- A1, A4, A5 vs. B3, B4, B5 resulted in 6-6 over 17 possessions; current score 26 – 16
- A2, A3, A4 vs. B2, B3, B4 resulted in 4-7 over 10 possessions; current score 30 – 23
- A2, A3, A5 vs. B2, B3, B5 resulted in 5-7 over 16 possessions; current score 35 – 30
- A1, A2, A3 vs. B2, B4, B5 resulted in 4-5 over 8 possessions; current score 39 – 35
- A1, A2, A3 vs. B1, B4, B5 resulted in 4-7 over 10 possessions; current score 43 – 42
- A3, A4, A5 vs. B1, B4, B5 resulted in 4-0 over 8 possessions; current score 47 – 42
- A1, A3, A4 vs. B1, B2, B3 resulted in 5-2 over 10 possessions; current score 52 – 44
- A1, A4, A5 vs. B2, B3, B4 resulted in 2-9 over 14 possessions; final score 54 – 53
Each row is called a stint; or a section of time that a grouping of players are on the court. A stint starts, in this case, when possession starts for all six players on the court; and terminates when either a substitution is made or a period is ended. For our hypothetical game there are eleven stints.
Traditional Plus Minus (+/-)
The traditional measure used to identify contribution of a player is the plus-minus, (+/-). This value is a simple calculation of the difference of number points a team scores and the number of points their opponent scores. In our example, player A1 starts the game at 0 – 0 and exits at 26 – 16 for a (+/-) of 10. Player A1 enters the game a second time with a score of 35 – 30 and exits with a score of 43 – 42. This time, player A1 is outscored 8 – 12 to finish with a (+/-) of 6. Finally, Player A1 returns for the ending of the game, getting outscored 7 – 11 to finish with a (+/-) of 2. Computing this quantity for all players, we have that:
- Player A1 2
- Player A2 -5
- Player A3 2
- Player A4 3
- Player A5 1
- Player B1 -14
- Player B2 6
- Player B3 3
- Player B4 6
- Player B5 -4
Note that they sum up to zero. This better happen for any game. If we went solely off of plus-minus, we would see that Player B2 and Player B4 are the players of the game, while player Player B1 is the worst player of the game. However, is this really so? Are we able to make an argument that Player A4 is the best player and that Player B4 just reaped rewards of not having to play with Players B1 and B5 at the same time at the end of the game? A simple solution is to consider the system of equations, which leads us to Adjusted Plus-Minus (Adj +/- or APM).
Adjusted Plus Minus (APM)
Adjusted Plus-Minus (APM) considers the system of linear equations that represents players playing on a court. The system is relatively simple. The set of equations are given by:

Let’s define some parts of this equation. First, the quantity Y_i is the average point differential of home team over away team per 100 possessions. The values X_ij identifies if player i on team X is playing in stint, j. To be complete, let’s assume Team A is the home team. Then, this value is -1 for a road player, 1 for a home player, and 0 if that player is not on the court. Let’s plug in all the pieces for our eleven stints:
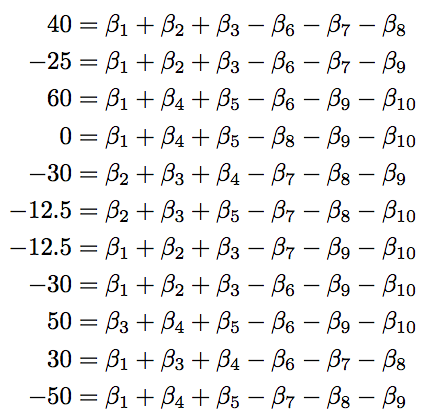
The goal is then to find values of beta that satisfy these equations as best as possible. Either by direct solution or by approximation.
Recall the Example
Let’s verify the first equation. For stint one, we saw Team A break out for an 11 – 5 lead over the course of 15 total possessions. Note that this is 8 possessions for one team, 7 for another. The differential is then +6 as it is calculated home score over stint minus away score over stint. Since there were 15 possessions, this breaks down to 0.40 points per home team gain per possession. We normalize over 100 points to obtain 40; which is exactly what we get for the value of Y_1.
Over this stint, players A1, A2, and A3 are on the court for Team A. They are all given 1’s. Similarly, players B1, B2, and B3 are on the court for Team B. They are all given -1’s. The other four players not in the game? They are given zeros, as they are contributing nothing on court for this stint. Plugging these values in, we get exactly the right hand side of the equation.
What Are Those Beta’s?
The beta values associated with the player is the weight of contribution that a player gives towards the differential. There’s a mechanical version of what this means from a regression point of view; but let’s not be hasty. That “hold all other players constant” bit doesn’t work here. There always has to be three players on the court. Let’s actually calculate this contribution.
If the player is added to the court, we must remove another player from the court. So let’s suppose that players A1, A2, and A3 are on the court. Suppose we wish to replace player A3 with player A4; while Team B introduces no changes. The difference between these lineups are (beta_4 – beta_3). To see this, take the proposed lineup and subtract the current lineup. This is what we get on the right hand side. However, on the left hand side, we get Y_2 – Y_1, where 2 just means proposed stint while 1 means current stint. This is the difference in differential per 100 possessions.
This means that the beta values are relative expected differential in contribution of a player with respect to replacement. This is not a player’s pure contribution, but rather their relative contribution. In fact, a player with positive weight can be a negative contribution. How so? Replace a player with an 8.049 beta with a player that has a 2.569 beta. We expect the new player to contribute less on the court than the previous player; as they are realistically a -5.48 contribution with respect to the previous line-up.
Assumptions, Assumptions, Assumptions
To solve for this linear system, we assume a great many things. Instead of focusing on the mundane, let’s discuss the really important assumptions.
First, we assume that contribution of a player can be realized by their expected value. That is, a player playing in their first minute is assumed to have the same impact as their 43rd minute, regardless of tempo, bench time, or opponent strategy.
Second, we assume that we can solve this system of equations. Sure, we can apply mathematics and get numbers; but they may not be reliable as the methodology may not satisfy our assumptions.
Finally, we like to identify these estimates to help with prediction. In order to do this, we must assume some sort of distribution on the data. The most commonly selected distribution? The Gaussian distribution. It’s nice and has fantastic properties, but is difficult to satisfy. For instance, it assumes that our data is continuous and takes a nonzero probability over the real line. That’s already violated as differential per 100 possessions is a discrete value that effectively maximizes at 400, barring crazy free-throw situations. Situations as this would be converted basket, missed free throw and offensive rebound, converted basket; etc.
However, most folks are willing to ignore the violation of these assumptions and proceed as usual. That’s not a major problem, provided there is enough data, and they can be indicated as being roughly shaped as Gaussian. We will return to this when proper.
Least Squares (Regression)
To solve this system of equations, we write the matrix form of the above system of equations.
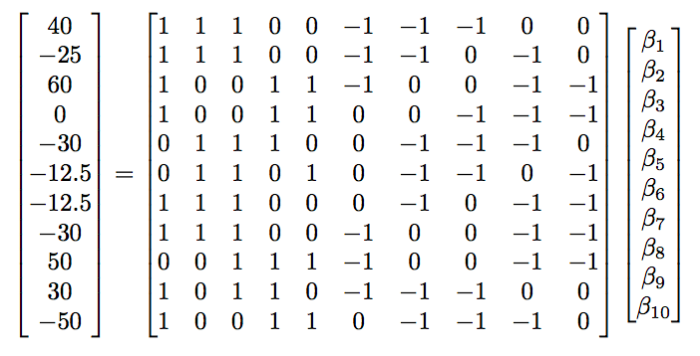
Next we multiply, on the left, the inverse of the player matrix. Unfortunately, we can’t just do that as the matrix is non-invertible and not square. Instead, we appease the Least-Squares formulation. To do this, we multiply both sides by the transpose of the player matrix. This will give us a square matrix against the beta-vector. Our system now looks nearly unintelligible:

The left hand side of this is merely identifying the differential per 100 possessions of Player A1. To see this, the transpose of the player matrix puts the column of whether Player A1 is on the court as its row. This row is then multiplied by the differentials. The result is given by 40 – 25 + 60 + 0 + 0 + 0 – 12.5 – 30 + 0 + 30 – 50 = 12.5. Think of this as the averaged traditional plus minus per 100 possessions. Granted, this is not quite so as the number of possessions differ from stint to stint; but that’s the effective representation of this vector.
The player matrix gains a really nice property. We now see the number of interactions between the players. For instance Player A1 played in 8 of the 11 stints. Furthermore, Player A1 player with A2 four times, A3 five times, A4 four times, and A5 three times. Similarly, Player A1 played against B1 and B2 each five times, B3 and B5 four times, and against Player B4 six times. This matrix now counts the number of interactions between every player!
By multiplying by the inverse, we now obtain the average traditional (+/-) per 100 possessions per interactions of players on the court. This effectively identifies the amount of contribution that a player yields during 100 possessions, relative to the personnel played against! So let’s solve this.
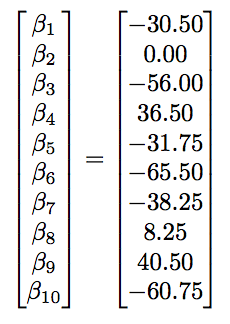
This shows that Player B4 is the top player of the game with an expected 0.405 point differential game per possession. What’s more important to glean is that Player B1, despite obtaining -14 (+/-), has strong competition from Player A3 of being the worst player of the game according to APM. Why is this the case? This is due to possession inclusion and player interaction. This shows us that depending on match-ups, we can see a fluctuation in a player’s output. We could not see that with traditional plus minus.
Now the question is… did this work properly? Note that I showed you a classic example with solutions that we can argue away; but did this actually work? Why is Player A2 worth nothing? First off, let’s be clear that I lied to you to get these coefficients. If you perform the above computation, we obtain a condition number problem. In fact, the above player matrix cannot be inverted! To identify the values above, I either have to cross my fingers and delete players (I can’t in this example) or I have to apply pseudo-inverses, a methodology in numerical and matrix analysis that allows us to approximate inverses for solutions to linear problems. In fact, it is this very reason that Dan Rosenbaum required throwing away several players over the course of multiple seasons in his initial articles on Adjusted Plus-Minus. By having 60,000 stints over 2 seasons for approximately 500 NBA players, Rosenbaum was able to gain some flexibility in obtaining an invertible matrix for regression.
Let’s walk through the rest of this scenario and expose what happens next…
Error Estimation
The above least squares solution is merely an approximation. This means that there is error involved with the calculation. Assuming Gaussian distributions, we can compute the associated error relatively easy.
First, we must compute and overall variance error. One way to do this is to compute residuals. Residuals are effectively the averaged error of estimated responses to the true responses.
Given our estimated betas, we can compute the predicted values of differential per 100 possessions. In doing this, we obtain something quite blasphemous! First, let’s compute these predicted values:
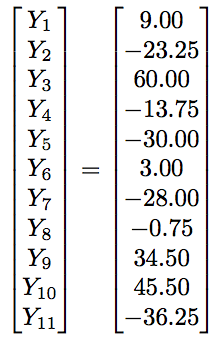
These values are not too far off from the truth! Taking the difference from the truth values and summing their squares, we obtain 3158.8. Note that Player A2 is viewed as non-existent. This means that the regression model identifies that there are only 9 players to compare; not 10. In this case, to obtain the average deviation, we divide the residual sum of squares by 11-9 =2, instead of 11-10 = 1. This gives us an approximated error of 1579.4.
Next, we compute the associated variance of the beta’s. This is important. The variance requires that same inverse calculation above. Hence we need to have a pseudo-inverse again. The result gives the following:
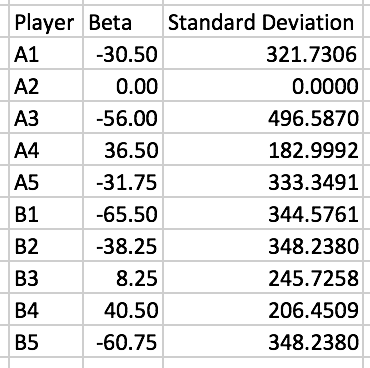
As we can see, the variance is HUGE. Emphasis on huge. So much so that none of the values above allow us to state, statistically speaking, that Player B4 is indeed the best player on the court. So while APM is a huge improvement over the (+/-) statistic, it still fails miserably in its basic sense.
Instead there are two areas for improvement if we attempt to enforce linear methods for predicting player contribution: model specification (Rosenbaum’s methodology in the link above) by tailoring inputs, removing players, or adding years upon years more of data; or applying a filtering technique such as Regularized Adjusted Plus Minus.
Regularized Adjusted Plus Minus (RAPM)
If we look at the player interaction matrix above, we find that the rank of such a matrix will always be at most N-1, where N is the number of players. Think of the reasoning this way. We know in an NBA game, there are ten players on the court at any given time. Suppose there are N players total in the league. Each degree of freedom, or independent pieces of information, is equivalent to asking each player “are you in the game right now?” If we ask the first N-1 players, we know whether player N is in the game without having to ask him, regardless of permutations in asking which players.
If this rank is never N, then we cannot invert the player interaction matrix! Hence, another methodology is required. Such a methodology is given by ridge regression. Ridge regression applied to APM yields the model most commonly known as Regularized Adjusted Plus Minus (RAPM).
Ridge Regression
Ridge regression is a Bayesian filter with a particular goal in mind: if we apply a slight perturbation to the player interaction matrix, we can guarantee the matrix is invertible. While we introduce a slight bias in the results, the bias is nearly negligible and we obtain low-variance estimates for each player. And we don’t have to throw out players.
What this means in, in the above problem, if we write the least squares problem as

we then obtain the perturbation form of

This time, the matrix is invertible and we are able to obtain estimates for beta. This perturbation is serves two purposes. First, it is a regularization on the betas. This means that we take the linear model (APM):

and put on a regularization term. If you are unfamiliar with regularization, think of it as a penalty for being abnormal. That is, if a value looks like he’s getting too far away from what should be expect (or “regular”), then we penalize that value and force him back to the group of other betas; or make that value look like any other old value. In this case, we penalize by adding on a square term:

The solution to this equation is now

Note that this isn’t exactly beta, but rather an approximation.
Now second, this regularization serves as a dimensionality reduction technique. If lambda is zero, then we obtain the least squares model above! This is bad news as we saw what happened with APM. However, is lambda is infinity, then the inverse is effectively zero, meaning that no players have contribution! This means we range between N players and 0 players yielding meaningful contribution to point differential. Because of this, you may hear of ridge regression as a shrinkage method, as the coefficients shrink towards zero as lambda increases. This value of lambda attempts to control multicollinearity between the players.
In fact, here’s the written work, if you are willing to delve into graduate level statistics; as I learned at Wisconsin as a wide-eyed 23 year old:
What this means now is, we focus on selecting a proper lambda and compute the estimates for beta. There are methods for finding a “comfortable” lambda and will hold off on describing those methods for later.
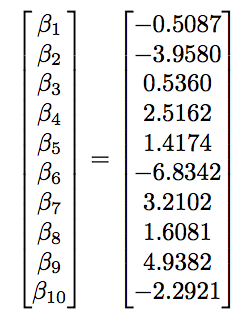
Instead we look at the coefficients for our ten players over different values of lambda.

First, we see the wildness of APM at the far left side. Next, we see all the coefficients converge towards zero as lambda blows up. Hence, we pick a warm fuzzy location and select for our analysis.
Interpretation of the Coefficients: Bayesian Methodology
Interpretation of the coefficients is no easy task. We cannot simply do the subtraction trick above, as there is now a regularization term. Instead, we focus on the actual statistical process.
Ridge regression is actually a Bayesian filtering process, where the coefficients are seen as random quantities that follow a mean-zero Gaussian distribution, called a prior distribution. The value of lambda identifies the variance associated with the Gaussian and therefore controls how quickly each beta value will shrink with respect to lambda.
In light of this, the coefficients are interpreted as follows: amount of differential contribution with respect to variation. Here, the variation is lambda; which filters large-magnitude values of beta out. We can think of this as approximate differential contribution scaled by lambda.
Taking a look at the players from our simple example, we have that Player B4 is the top player; while Player B2 is right beside him. Effectively, this agrees with (+/-), but more importantly is attempting to negate out the effects of Player B1 on both players.
What we cannot state is that Player B4 contributes 1.17724 more points per possession for his team than Player B1 in the same situation. This has to be said, relative to lambda = 20. Regardless, this provides for a methodology of understanding the value of a player within a particular system; and hopefully gives insight on how PM, APM, and RAPM work.
In our next article, we take a deep dive looking directly at the 2017 NBA season.


Pingback: Deep Dive on Regularized Adjusted Plus Minus II: Basic Application to 2017 NBA Data with R | Squared Statistics: Understanding Basketball Analytics
Pingback: Deep Dive on Regularized Adjusted Plus-Minus I: Introductory Example by Justin Jacobs | Advance Pro Basketball
Could you please post the original dataset? We have a dataset including time and substitution, will it simplify the calculations and be more specific? I don;t know how to get the X values for each player.
LikeLiked by 1 person
Pingback: Deep Dive on Regularized Adjusted Plus-Minus I: Introductory Example — Squared Statistics: Understanding Basketball Analytics | Advance Pro Basketball
Pingback: Weekly Sports Analytics News Roundup - October 24th, 2017 - StatSheetStuffer
Pingback: Bradley-Terry Rankings: Introduction to Logistic Regression | Squared Statistics: Understanding Basketball Analytics
Pingback: Tyreke Evans Is Back – Sidekick News
Pingback: The Components of Offense: Turning the Lurk into a Feature | Squared Statistics: Understanding Basketball Analytics
Pingback: Regularized Adjusted Plus-Minus Part III: What Had Really Happened Was… | Squared Statistics: Understanding Basketball Analytics
Pingback: Wins Above Replacement: The Process (Part 2) | Hockey Graphs
Pingback: Drive For Dough And Putt For Show - Part 4: C1X Putting | Ultiworld Disc Golf
Pingback: Drive For Dough And Putt For Show – Part 4: C1X Putting - Disc Golf Network
Pingback: Row 81 added to - stewardship digital
Pingback: Regularized Adjusted Plus/Minus (RAPM) – Basketball, Stat
Pingback: Exercising Error: Quantifying Statistical Tests Under RAPM (Part IV) | Squared Statistics: Understanding Basketball Analytics
Pingback: Manifold Nonparametrics: Which Way Do Passers Pass? | Squared Statistics: Understanding Basketball Analytics
Pingback: Basketball, Stat: Regularized Adjusted Plus/Minus (RAPM) – dogankent
Pingback: Using Numbers to Talk About Offense and Defense - Liberty Ballers
Pingback: Descriptive Analytics 101 – Advanced Statistics and Plus/Minus Data | Cryptbeam
Pingback: Quantifying Relative Soccer League Strength – Data Science Austria
Pingback: Quantifying Relative Soccer League Strength | R-bloggers