A possession is defined by the NBA as
Section XVIII-Team Possession
A team is in possession when a player is holding, dribbling or passing the ball. Team possession ends when the defensive team gains possession or there is a field goal attempt.
There is a little change to that definition even, as a field goal attempt does not really indicate the end of a possession. In analytics, possession changes occur when one team yields the ball to the opponent for an opportunity to hold, dribble, or pass the ball. This means technical free-throws alone are not possessions.
As basketball analytics have evolved and started to look more like how players, coaches, and executives think; we have seen a significant rise in “per possession” or “per 100 possessions” analytics. Roughly fifteen years ago, the Hollinger metric capitalized on this plus-minus type idea by introducing the Player Efficiency Rating (PER); a “per minute” analysis that normalizes player productivity in accordance to tempo of the team as the league average is normalized to 15.0. Recently, we have received possesion-type analytics such as spacing metrics to identify the average type of spacing for a team’s particular play; or even expected number of positive actions on offense and defense for each player in correlation with other players on the court. Call this latter metric the “super plus-minus.”
Each have their information gain, as well as glaring holes. For instance, PER suffers from players who do important tasks that are not directly found in the box score. Here, it claims that defensive stalwarts are near worthless and tends to overvalue players that are effective due to systems. Similarly, the expected number of positive interactions will over-weight starters that are solid contributing role players. This is due to the cross-correlation whitening process that is used to remove correlation between all players.
In these cases of analytics, items such as PER and spacing are derived from box scores. The super plus-minus requires play by play data. This means, possession data must be derived or counted.
Box Score is Not Enough
The box score of a game yields many basic statistics such as rebounds, steals, assists, points, and so on. From here, the NBA derived a metric for estimating possessions. To summarize, it says:
So this means the estimated number of possessions is (FGA-OREBS) + TO + (.436 x FTA). Let’s break down what this means… A possession is the number of Field Goals attempted where Offensive Rebounds are not a result. This means we are counting the number of Made Field Goals and Missed Field Goals that result in Defensive Rebounds. Hence possession changes due to field goal attempts. Then add in the number of Turnovers. Finally, only add in 43.6% of Free Throw Attempts. Why only 43.6%? This is because only 43.6% of free throw attempts resulted in a Made Last Free Throw Attempt or a Missed Last Free Throw Attempt with a Defensive Rebound. This means that almost every part of the end of possessions are incorporated directly in the estimated number of possessions. HOWEVER, the weight of the free throws resulting in a change of possession may change from year to year. In fact, a nice study done by Matt Femrite shows that this percentage is actually on the decline over the years.
If we used this algorithm, we would overestimate the number of possessions by 7,739 possessions!! Oops. In fact, in the aforementioned article highlighting the over-estimation; the NBA formula is not used, but rather a surgical method for estimating possessions is used. Here’s the surgical procedure:
Possessions (available since the 1973-74 season in the NBA); the formula for teams is 0.5 * ((Tm FGA + 0.4 * Tm FTA – 1.07 * (Tm ORB / (Tm ORB + Opp DRB)) * (Tm FGA – Tm FG) + Tm TOV) + (Opp FGA + 0.4 * Opp FTA – 1.07 * (Opp ORB / (Opp ORB + Tm DRB)) * (Opp FGA – Opp FG) + Opp TOV)). This formula estimates possessions based on both the team’s statistics and their opponent’s statistics, then averages them to provide a more stable estimate.
Using this model for estimating possessions, we get a much better approximation; but still heavy over-estimating. In total, considering all possessions, this model is only off by a total of 2,189 possessions. Before you say “wow, that’s a large number,” remember that there are 1,230 total NBA games in a season. This number reflects 1.77 possessions being over estimated per game; compared to the NBA model being off by 6.29 possessions per game. More on this model later. First, let’s count.
Counting Methods Require Play-By-Play Data
If play-by-play data are available to the user, a simple counting argument may be performed to count the number of possessions. Recall that a possession is terminated by
- Made Field Goal Attempts
- Made Final Free Throw Attempt
- “and-One” situations following a converted field goal attempt
- Final attempt on non-“and-one” attempts.
- Missed Final Free Throw Attempt that results in a Defensive Rebound
- Missed Field Goal Attempt that results in a Defensive Rebound
- Turnover
- End of time period
Most times the end of a time period is stripped/ignored as these attempts are typically “heaves,” where a player throws a ball from a completely unorthodox position with hopes of the ball going in the basket, or “dribble out” scenarios, in which the teams dribbles out the clock.
Hence the counting method is simple. Count possessions that occur when any of the above criteria are met. In the above, we look at all situations above and remove end of time period numbers. Despite removing these values, we will include heaves provided that the NBA considers them a bona-fide shot attempt.
When performing this counting project, we merely set up a rule based system that follows the above criteria:
possessionChanges = tempDataframe.loc[df[‘event_type’].isin([‘shot’,’turnover’]) | df[‘type’].isin([‘rebound defensive’]) |
((df[‘num’] == df[‘outof’]) & (df[‘result’].isin([‘made’])))]
When this is applied, we get the following counts of possessions:

Distribution of possessions for each team for the 2016-17 NBA Season.
The Surgical Model (Basketball Reference)
Let’s return to the surgical model. Recall that the function is this:
0.5 * ((Tm FGA + 0.4 * Tm FTA – 1.07 * (Tm ORB / (Tm ORB + Opp DRB)) * (Tm FGA – Tm FG) + Tm TOV) + (Opp FGA + 0.4 * Opp FTA – 1.07 * (Opp ORB / (Opp ORB + Tm DRB)) * (Opp FGA – Opp FG) + Opp TOV))
Let’s break this down. First, this is an average of a team’s offensive statistics and their opponents offensive statistics against them. The idea is that a team’s pace and style may dictate the number of possessions in a game. For instance, some teams cause more technical fouls while other teams run into a higher rate of team rebounds. This is what that “0.5” value at the start of the equation indicates. This means there will be two halves to this equation: a Team Half and a Team’s Opponent half.
Team Half First:
The team half is
(Tm FGA + 0.4 * Tm FTA – 1.07 * (Tm ORB / (Tm ORB + Opp DRB)) * (Tm FGA – Tm FG) + Tm TOV)
This actually isn’t too bad to break down. Here, we have Field Goals Attempted plus 0.4*Free Throws Attempted. Again that rotten hard-coded weight is placed here. This time, instead of the NBA proposed .436, it is .4. We also see Turnovers included. What we are missing is the removal of Offensive Rebounds. Instead, we are given
This is a weighted ratio of Field Goals Attempted minus Field Goals Made. This counts the number of misses. Instead of adding directly, misses are weighted by the ratio of Offensive Rebounds to Total Possible Rebounds on the Missed Field Goal. Think of this weight as the percentage of rebounds possible that are offensive. Finally, similar to the Free Throw weighting, there is a 1.07 weight placed on this weighted percentage of field goal misses that are offensive rebounds.
Hence there are two weights that have to be questioned: Free Throws Attempted and Percentage of Missed Field Goals that are Rebounded by the Offense.
Team’s Opponent Half
Same as the Team Half, but for what the opponents did against that team.
For instance, the Charlotte Hornets had 7000 attempted field goals, 942 turnovers, 1953 free throws attempted, 721 offensive rebounds, 3093 field goals made, and 2853 defensive rebounds. Their opponents had 7092 attempted field goals, 1071 turnovers, 1496 free throws attempted, 732 offensive rebounds, 3237 field goals made, and 2909 defensive rebounds.
Team Half: 7000 + 0.4*1953 – 1.07*(721/(721 + 2909))*(7000 – 3093) + 942 = 7892.8603
Opp Half: 7092 + 0.4*1496 – 1.07*(732/(732 + 2853))*(7092 – 3237) + 1071 = 7919.1712
Average both to get 7,906 possessions; or 102 possessions over-estimated against 7,804 actual possessions.
How Does the Surgical Method Perform for All Teams?
Computing the surgical method we find the following results:
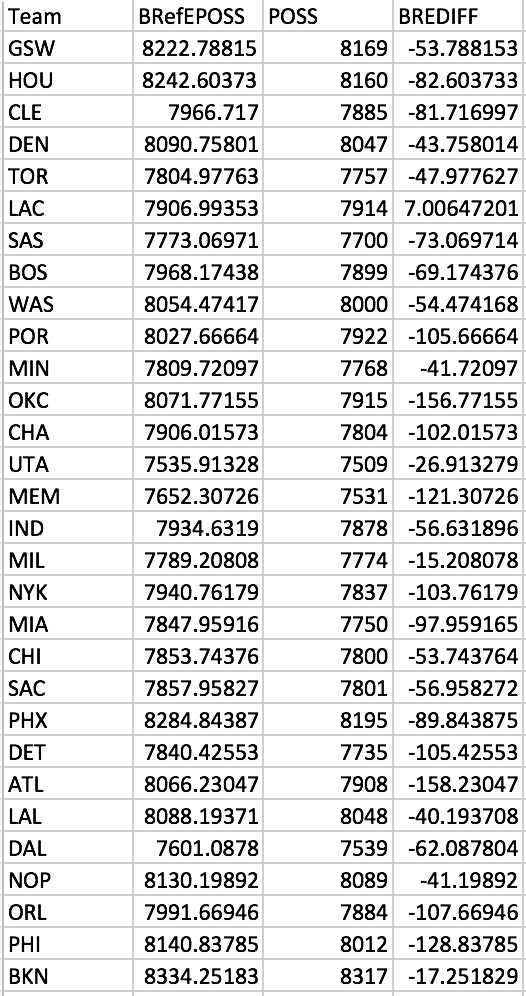
Comparison of counted possessions (Poss) and the Surgical Model (BRefPoss) and calculated bias (BREDIFF). Negative values are over-estimated possessions.
We see that 29 of the 30 NBA teams are over-estimated by the surgical model. The only team not over-estimated? The Los Angeles Clippers. In fact, the Clippers are missed by only a total of seven possessions. There are nine teams that have more than 82 possessions over-estimated. The most egregious one is a miss by 158 possessions for the Atlanta Hawks; for an average of 1.93 possessions per game.
So What’s Off?
Recall that the only two weights that exist are on Free Throws Attempted and Percentage of Offensive Rebounds on Missed Field Goal Attempts. Let’s look at these values.
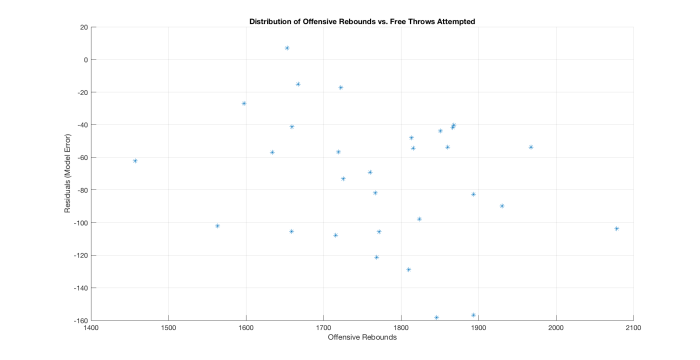
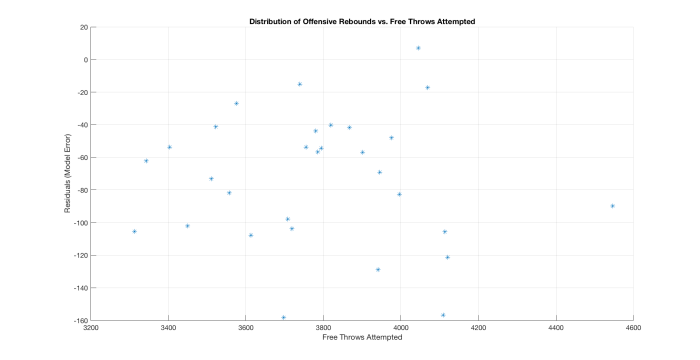
We find that there is no distinct correlation in Offensive Rebounds and Free Throws Attempted against the Model Errors. If there were such as situation, we should see tend in one direction more than another. Since team labels are not attached the the graph, we can look at the three dimensional plot (but it’s not that helpful)!
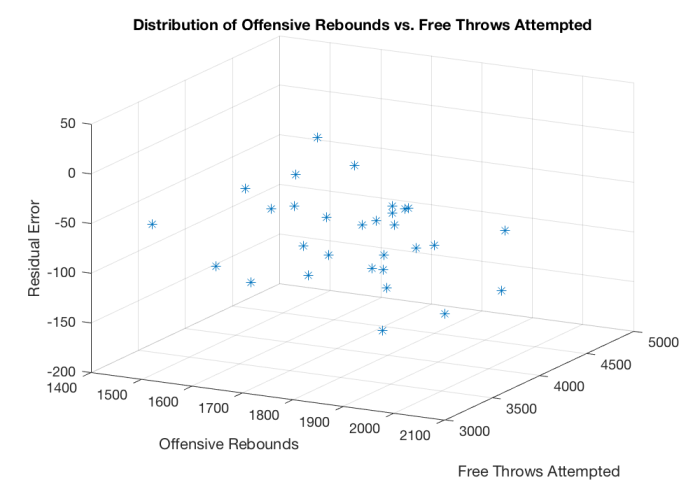
We look for clusters in the large residual error (more than -80), but no clusters exist.
Let’s look at the weights directly. We can do a line search to look for the weights that best fit the data. To do this, let’s apply a simple optimization to identify the proper weights for the 2016-17 NBA season. Applying a Nelder-Meade search, we find that at about 20 iterations we obtain the weights of interest.
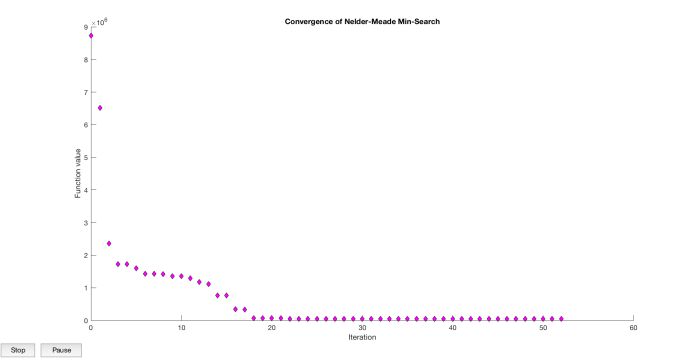
Convergence of Nelder-Meade algorithm to find the ideal weights for Basketball Reference’s surgical model.
The results yield 0.4328 for the Free Throws Attempted coefficient and 1.2228 for the Offensive Rebounds. Applying these coefficients we go from over-estimating possessions by 2,188 to under-estimating possessions by 7.6895.
This is a global minimization, as teams are nailed perfectly (Boston Celtics: 7899 vs. 7898.38) and are at worst 66 possessions off (Oklahoma City Thunder: 7915 vs. 7994.49). In fact, under the surgical model, only one team was within ten possessions. Under this optimization, there are six teams within ten possessions. Similarly, we find that almost every team is within 50 possessions (5 are not), unlike the surgical model that sees 21 of 30 teams with more than 50 possessions off.
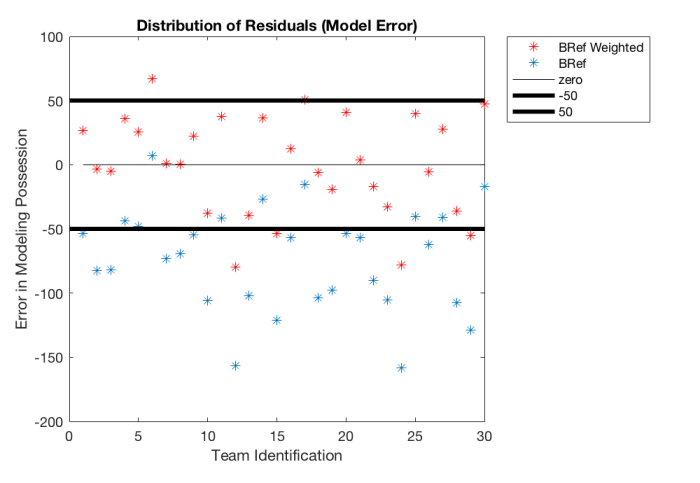
Distribution of errors modeling team possessions. The reweighted values (red) are primarily within the +-50 possessions of error (bold black lines) whereas the Bsaketball Reference values are biased in the over-estimating direction and primarily outside of the +-50 band.
Conclusions
So what did we learn? We see that if we are restricted to box scores, finding weights to account for the number of free throws actually end a possession and the number of rebounds that may turn into dead-ball possessions (team rebounds) is a must. In the presence of play-by-play data, we indeed obtain these counts immediately; and typically in less than a minute over 1230 games. But this allows the common user to update weights; as we have seen the weights in both the NBA model and Basketball Reference models need constant updating.
So what do you think? Are you able to better estimate the number of possessions? If so, sound off!


Pingback: Breaking Down Player Efficiency Rating | Squared Statistics: Understanding Basketball Analytics
Pingback: Understanding FG% and Rebounding in Player Efficiency Ratings | Squared Statistics: Understanding Basketball Analytics
Pingback: Deep Dive with Python: Offensive Ratings | Squared Statistics: Understanding Basketball Analytics
Pingback: Offensive and Defensive Ratings | Squared Statistics: Understanding Basketball Analytics
Hi Justin, great stuff as always!
I was looking to calculate the Offensive Ratings from the play-by-play data.
While the Possessions part is clear, I haven’t found any resources about the Points Produced calculation.
Would you be able to give some hints about Point Produced calculation from play-by-play data.
Thanks!
LikeLike
Thanks for the read! Points Produced was introduced in Dean Oliver’s Basketball on Paper. However, Justin Kubatko put together a synopsis of how it is calculated on basketball reference: https://www.basketball-reference.com/about/ratings.html
Hope this helps!
-Justin
LikeLike
Hi Justin, yes I have seen the synopsis and calculated the Points Produced based on the Box Scores. I was just wondering if there is any optimized version of it in the case of availability of play-by-play data.
LikeLike
Pingback: Identifying Fast-paced Euroleague Teams – Euroleague Data Guy
Pingback: True Shooting Percentage Part I: Introduction and Framework for Advancement | Squared Statistics: Understanding Basketball Analytics
This was very interesting Justin. Your work into advanced stats may seem complex to the average sports fan but you lay out very thorough arguments that go step-by-step making them far easier to follow. I had read into your PER analysis and was wondering what you thought about three point attempts likely yielding more offensive rebounds? I have done no research no on the concept yet, so I have no idea if there is any correlation. To me the simple logic would be longer shots produce longer rebounds on misses, giving the offense a higher chance at recovering the ball. Also with assists, you were very critical of how they generally do not help a player who is more apt to score and get substantial assists. Do you have any ideas on how the PER formula could be altered to give them a more accurate representation of their value?
LikeLike