With the NBA Draft 22 days away, we would like to take a moment to show the impact of the previous 23 NBA Draft lotteries and show if whether draft position really truly matters. Hint: it does, but only to an extent. We’ll explain below.
We focus on all draft picks since 1994, and not since 1985, because the current NBA draft lottery system has been the way it is today since 1994. Prior to 1994, we had wildly different probabilities that could move teams from first to seventh in no time flat. Now, it’s highly structured with focus to actually help the worst teams in the league.
Since 1994, there have technically been 309 draft slots. Despite the Washington Wizards forfeiting their 1997 draft pick for their signing of Juwan Howard and the three forfeited draft picks of the Minnesota Timberwolves for repeated salary cap violations, no lottery spots have been forfeited.
The goal of the NBA Draft is to give teams the chance to build parity in the league. With the aim of putting the best players coming into the league onto the worst teams, we expect those players to grow into NBA stars and be fighting in the playoffs in no time; or at least within three years. However, to avoid tanking in the previous season to obtain the best picks, the draft lottery probabilistically creates potential parity. Combine this with the high variability in many players coming into the draft, we find that while sometimes teams become stronger after their lottery picks, some teams wallow in the basement for a few years longer.
Here, we take a look at the 309 picks over the years and focus on where draft order helps and hurts. We also take a cursory look at how these 23 classes compare.
Heading to the Playoffs!
With 309 total players over the course of 23 years, and not including retirements, there are a possible 2,354,213,030,699 (over 2 trillion!) post-season appearances by lottery picks since 1994. In reality, since only 16 teams get in and not all lottery players are on those 16 teams, we should expect a much much smaller number.
In fact, there have only been 1,177 post-season appearances by lottery picks drafted since 1994.
If we average that out, this means we expect each lottery pick to appear in less than 4 post-seasons over the course of their career. The exact value is 3.809 post-season appearances. Correcting for early career players; players in their first year, this really translates to an expected value of postseason appearances for veteran players to be about 5 (It’s actually 4.804). The distribution of postseason appearances is easily viewed as a histogram.

Distribution of number of postseason appearances in the NBA since 1994 by 1994-2016 NBA Lottery picks. X-Axis is number of years appeared; Y-Axis is count of players.
We see that there is a lone player has made 18 postseason appearances: Tim Duncan. Second on that list has 17. That’s Jason Kidd. We don’t plot the zeros on this list; however there are sixty-three lottery pick players that have never been to the playoffs. That number is a little misleading, since effectively half of those players have been drafted since Anthony Bennett’s selection as Number One in 2013.
The year by year break down is as follows:

Distribution of playoff appearances for each lottery draft year. 1998 leads all years with 95 appearances.
Here we see the 1998 draft year lead all lottery years with 95 playoff appearances. This year is highlighted by Dirk Nowitzki (9th pick, 15 appearances), Paul Pierce (10th pick, 14 appearances), and Vince Carter (5th pick, 11 appearances). Between these three players, 40 of the 95 appearances are accounted for. If we take this one step further and include Mike Bibby (2nd pick, 10 appearances), we have 50 of the 95 appearances accounted for. That means the other nine players account for 45 appearances; an average of five appearances each over a possible 20 year career.
Similarly, if we take a look at the vaunted 1996 Draft class; considered to be the deepest draft class over the previous 25 years, we have only 81 playoff appearances. This class is highlighted by Kobe Bryant (13th pick, 15 appearances), Marcus Camby (2nd pick, 11 appearances), and Ray Allen (5th pick, 11 appearances). These being the only players to hit double digits, they account for 37 of their classes’ 81 appearances. While the class of 1996 also carries Allen Iverson (1st pick, 8 appearances); the next big lottery name is Erick Dampier (10th pick, 7 appearances). Maybe the class of 1996 isn’t as amazing as it has four-five hall-of-fame worthy players… Insert blasphemous retorts here.
The 2003 class is gaining a head of steam and may take over the most amount of playoff berths in a fairly quick manner. Especially with LeBron James (1st pick, 12 appearances) leading the charge. However, with the likes of Chris Bosh (4th pick, 6 appearances) and Dwyane Wade (5th pick, 12 appearances) slowing down, or even being out for the rest of their career, it may be questionable for the class of 2003 to cover the fifteen year difference between them and the class of 1998.
Here’s the year to year breakdown, by draft order:

Distribution of playoff appearances by draft pick number; indexed by year. What an ugly plot…
What we see is a complete noodle soup of 23 years worth of time series data. There are three intelligible things to take away from this noisy plot. First, almost every year is tangled between 2 and 6 appearances. We can’t decipher which year dominates other years; and we can’t even identify the most recent years as being almost non-existent on this plot. But we see that the bulk of the distribution is centered about 2 to 6 appearances for the most part.
Second, we also see that the trend does not fall down. This is important. This suggests that while high draft numbers (1,2,3) may be valuable to land the top talent, it does not necessarily translate to having an advantage at making the playoffs. To be fair, we have not quantified this; so we would like to test this statistically. We will in a moment.
Lastly, we can see the exceptions; the premier players. The value (1,18) is Tim Duncan. The value (2,17) is Jason Kidd. The values (4,14) and (5,14) are Rasheed Wallace and Kevin Garnett, respectively. The values (9,15) and (10,14) are Dirk Nowitzki and Paul Pierce, respectively. Finally, the value (13,15) is Kobe Bryant. We see how these future hall-of-fame players bubble up above the rest distributionally. So much so they may be deemed as outliers.
Let’s re-purpose this image to make it a little more understandable:

Surface Plot of Playoff Appearances over Year and Draft Number.
Here, we can see the downward slope over the years; which makes sense as it is impossible for any player drafted in 2003 to appear in 15 or more playoff appearances by their 14th year. Similarly, for any player drafted in 2010, it is impossible to appear in nine or more playoffs after their first 8 years. We can also see the uptick in lottery pick number 14 in the year 2005 as no fourteenth pick existed in the lottery pre-2005.
Again, we see the Mount Rushmore of playoff appearances; and we even go the extra bit to label the peaks. Here, we filter the noise of the two-dimensional plot and we can see LeBron James’ peak midway across the years and at the back (three peaks from Jason Kidd along the back). That other #1 draft pick peak? That’s Kenyon Martin.
From this plot, we see a little bulge of higher order draft picks in the more recent years getting a few extra playoff appearances than the lower picks. These players are Kevin Durant (2nd Pick, 7 appearances), Al Horford (3rd pick, 9 appearances), Russell Westbrook (4th Pick, 7 appearances), Blake Griffin (1st Pick, 6 appearances), James Harden (3rd Pick, 8 appearances), and Evan Turner (2nd Pick, 6 appearances). This is in contrast to the two-dimensional plot’s appearance that higher picks don’t necessarily translate to more playoff appearances. So let’s finally test this.
To test this, we will have 14 groups of Draft Numbers; each with a respective count of playoff appearances. Due to Group 14 (14th pick in the lottery) being more recent, we should expect this group to be significantly different than the rest. We are more interested in the differences between 1 and 10.
For instance, if we test pairwise differences between the #1 picks and every other draft picks’ playoff appearances, we find that there is only significance between the #6 and #14 picks. The difference between the #1 and #14 picks makes sense. The #14 pick did not start until 2005 and therefore cannot have more than 12 playoff appearances in their careers. The best #14 pick when it comes to playoff appearances? Ronnie Brewer.
The p-value for the Mann-Whitney test between #1 picks and #6 picks is 0.0396. This is significant; effectively the only real significant p-value other than the 0.0002719 when compared to #14 picks. The cumulative distribution plot of the #1 picks and the #6 picks are given below:
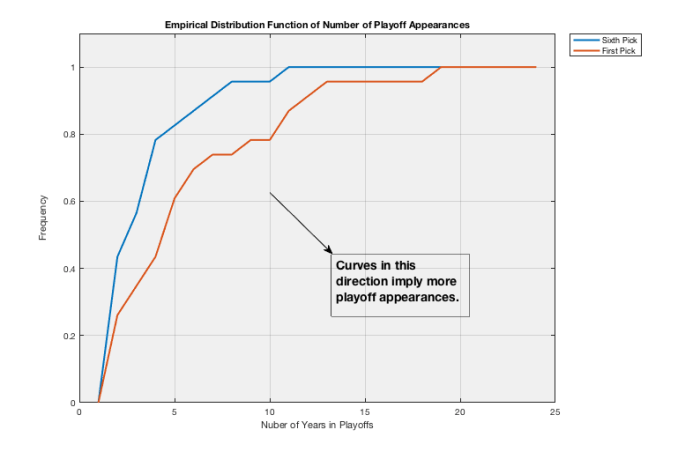
We see that the First pick is completely in the interior of the sixth pick. This indicates that the first pick of the draft spends more time in the playoffs than the sixth pick; therefore their convergence to 1 is much slower. Compare this to the distribution of the fifth pick… we have a p-value of 0.9735. Meaning that these two picks are virtually identical when it comes to playoff appearances.

Here, we see that the number of years in the playoffs are almost virtually identical between the first and fifth picks. What this means is; for every Tim Duncan, there is a Greg Oden or Michael Olowokandi. Similarly, for every Nikoloz Tskitihvili there is a Kevin Garnett or Dwyane Wade.
Continuing on comparing years, we find that none of the lottery pick positions yield heavy favorites between years; other than the fourteenth pick in every comparison. There are some anomalies such as the third pick is significantly different than the 12th pick.
In total, there is little discrimination between the first and the thirteenth pick of the draft. With exception of the sixth pick. In fact, breaking down the number of playoff appearances over the number of possible years of existence, we have a correct number of playoffs appeared given below:
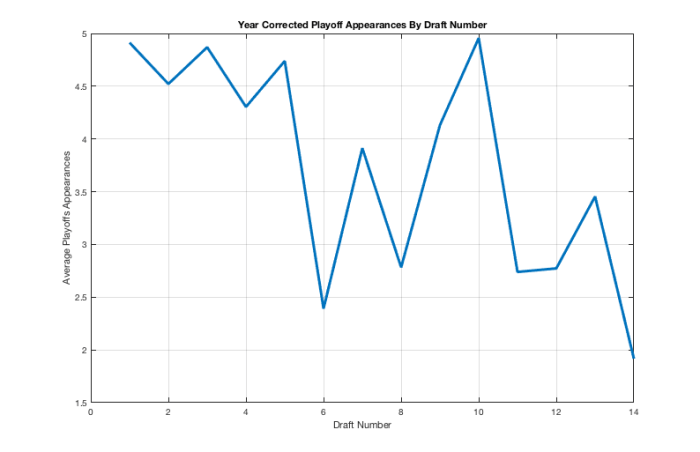
There appears to be a slight downward trend, but the noise associated with each average is enough to make trend insignificant (not really there). The exceptions are the sixth pick in the draft and the fourteenth pick of the draft.
So what’s the take away? It doesn’t matter where your draft position lands when it comes to making the playoffs. However, if we were to take a deeper look, draft picks don’t determine whether you make the playoffs. Instead, player development and trades make a much bigger impact.
Who Actually Makes the Playoffs?
The work above shows that while almost 80% of lottery picks make the playoffs and positions ultimately don’t matter; what does matter is who makes the playoffs. For instance, Kobe Bryant pulls the thirteenth pick up. Quite a bit. While there are 21 other thirteenth picks out there, Bryant makes up for 15 of the 76 playoff appearances. Far more than his 1/21 share. So let’s isolate these numbers quick before moving on.
In this analysis, we only indicate if a player makes the playoffs. So Kwame Brown and Jason Kidd? Equals. All we care is that the player makes the playoffs. Recall that of the 309 lottery picks, 246 made the playoffs. In fact, it’s not the first pick in the draft that has the most players who made the playoffs. Similarly, the first pick of the draft don’t even have the most amount of playoff appearances.
While the first pick of the draft has 113 appearances across 19 of its 23 possible players, it is the tenth pick in the draft that has 114 appearances across 20 of its 22 possible players. This means the tenth pick in the draft has an important role in making the playoffs. But is it the most important?
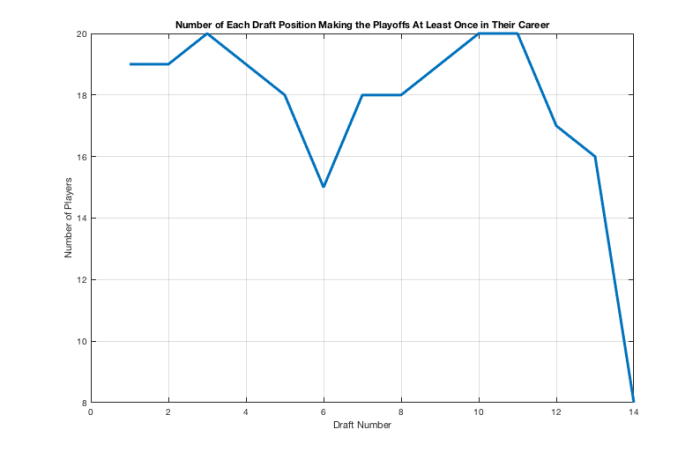
Distribution of players for each draft pick that have made at least one playoff appearance. We see that the third, tenth, and eleventh picks are each tied with 20 of 22 possible players.
Those tenth picks are: Eddie Jones, Kurt Thomas, Erick Dampier, Danny Fortson, Paul Pierce, Jason Terry, Keyon Dooling, Joe Johnson, Caron Butler, Jarvis Hayes, Luke Jackson, Andrew Bynum, Mouhamed Sene, Spencer Hawes, Brook Lopez, Brandon Jennings, Paul George, Jimmer Fredette, Austin Rivers, C.J. McCollum, Elfrid Payton, Justise Winslow, and Thon Maker. Not exactly a huge bunch of cornerstone players; but several strong number-2 or -3 options. The two players who never made a playoffs? Mouhamed Sene and Jimmer Fredette.
We also see that the sixth pick of the draft has only seen 15 of their possible 23 draftees make the playoffs. Effectively two-thirds. Those players? Sharone Wright (203 total games), Bryant Reeves (395 total games), DeJuan Wagner (103 total games), Jonny Flynn (163 total games), Jan Vesely (162 total games); and some newer players such as Nerlens Noel (2013), Willie Cauley-Stein (2015), and Buddy Hield (2016). It is safe to say the former five players listed are busts.
We also see that the thirteenth pick has only had 16 of its possible 22 selections make the playoffs. Again immortalizing Kobe Bryant as the greatest 13th lottery pick. In fact, the thirteenth pick has had as much problems as the sixth pick as Sebastian Telfair, Sean May, and Kendall Marshall are already out of the league; with three more players being recent draftees.
So from this graphic and some easy follow-on analysis, we see that drat position helps a little bit more, but picks one through eleven are effectively equivalent; except for the sixth pick.
OK. Everyone Makes the Playoffs. Who Wins?
Of the 309 total lottery draft picks since 1994, only 81 have made it to the NBA Finals. Of those 81, only 47 have won an NBA Championship. Let’s make the most restrictive argument ever. And suggest that every team who wins has the same roster. Since 1995, there have been 11 teams that have won an NBA championship. Each team carries approximately 15 members on their roster for a total of 165 NBA Champion players. That’s definiteively a lower bound. However, the total number of NBA Champions from recent lottery picks (1994 and beyond) is still even a quarter of that. We can thank Hakeem, M.J., and Shaq for some of that. However, those players have long since retired and we are still finding non-lottery players making noise: Draymond Green, Danny Green, Tony Parker, Ben Wallace, Tayshaun Prince for example.
If we are to dig deeper, we would find out that some of these players and winners are even riding the coat-tails of bigger superstars to get a chance to make a contribution late in their career. These are players such as Jason Williams and Richard Jefferson. Some of these players fall into the right place at the right time such as Darko Milicic and Adam Morrison despite yielding nearly zero contribution to winning and NBA title.
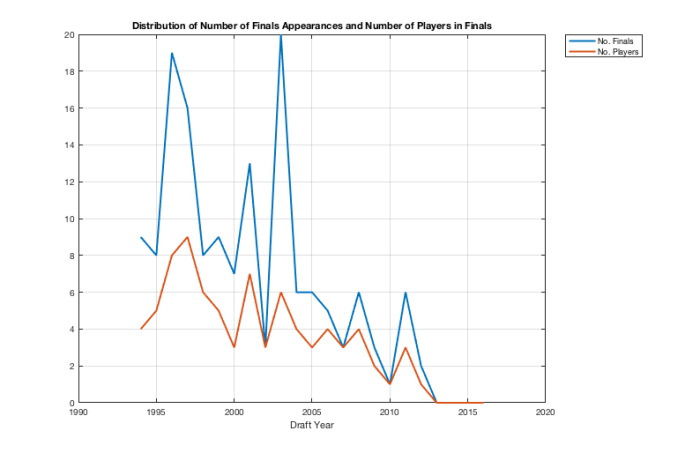
Distribution of the Number of NBA Finals appearances for each draft year, combined with the Number of Players to appear in a NBA Finals.
We see that 2002 suffers the worst fate with only three appearances for three players; one appearance each. Those players are Drew Gooden, Caron Butler, and Melvin Ely. none of these players were primary players for their respective team: Cleveland Cavaliers (2007), Dallas Mavericks (2011), and San Antonio Spurs (2007), respectively. Caron Butler was injured during the Mavericks finals run. Ely played less than three minutes a game. Gooden may have had the most impact.
However, we see that the 2003 class is above and beyond the other classes with 20 Finals appearances. The 1996 class trails with 19 Finals appearances and the 1997 class has 16 Finals appearances. These are primarily fueled by LeBron James (7 appearances), Dwyane Wade (5 appearances), and Chris Bosh (4 appearances) for the 2003 class; Kobe Bryant (7 appearances) and Ray Allen (4 appearances) for the 1996 class; and Tim Duncan (6 appearances) for the 1997 class.
What we do see is that the class of 1996 has put 8 of its 13 members into the NBA Finals. Some were key contributors such as Marcus Camby, Antoine Walker, and Kerry Kittles. Two were right-place-right-time in Samaki Walker and Erick Dampier. Some were key-players, option-heavy shooters such as Ray Allen, Allen Iverson, and Kobe Bryant.
The class of 1997 follows suit with 9 of its 13 members. Buoyed by Tim Duncan and Chauncey Billups, the class of 1997’s list of NBA Finalists is a list of strong role-players. These players include Tony Battie, Keith Van Horn, Antonio Daniels, Adonal Foyle, Austin Coshere, and Derek Anderson. If you haven’t heard of some of these guys, there’s a reason. The solid role player has a short life span in the NBA. For instance, Derek Anderson won an NBA title but only played in 615 games (approximately 8 seasons) for 29.22 minutes per game. That’s reliable numbers; but his title win was in 2006 with the Miami Heat when he was playing only a quarter of the season in a limited back-up role.
The other player became a ring chaser with excessively limited minutes in Tracy McGrady, during his unsuccessful run at a championship with the San Antonio Spurs in 2013.
Most importantly, this shows a sharp downward trend in the number of players who makes the finals relative to draft year. Some of this is two-fold. First, newer players take time to make the NBA Finals. It took LeBron James four years just to make a finals. And then another four years before he’d return for a second time. Even the best players have difficulty to make the NBA Finals on their own.
Second, when these players get into a groove and start making NBA Finals appearances, they hold down players that are relatively close to making the Finals. There’s only room for 30 players each year. With LeBron James closing the door on other players, we see newer players have to either wait their turn or get better. Thanks to the arms-race between Cleveland and Golden State, we should not expect this to change any time soon.
What this means is, we must find the right player to fit on a team and then accessorize that team with the right parts to make a championship run. This is why the San Antonio Spurs, Golden State Warriors, and Cleveland Cavaliers are strong contenders every year. While Cleveland boasts several lottery picks for their 2017 squad: seven. They have a slew of late round draft picks that play vital roles such as with J.R. Smith, Iman Shumpert, and Kyle Korver. Similarly with the 2017 Golden State Warriors, they boast five lottery picks on their team with several key late draft picks in Draymond Green, David West, and JaVale McGee.
If we take a different look at the draft position of the players who make the NBA finals, we see a similar story as in the playoff appearances.
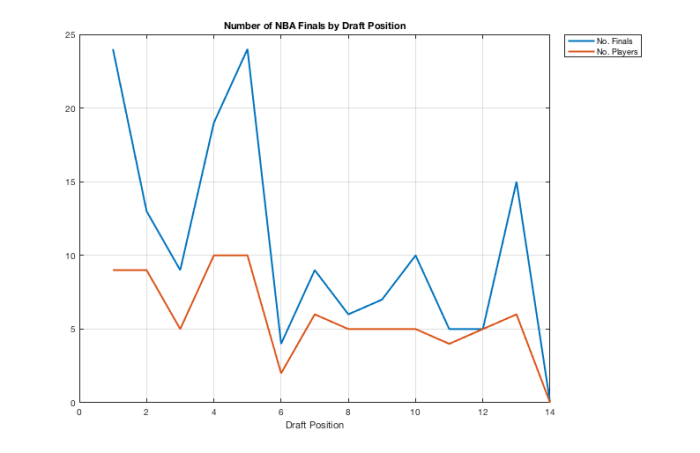
Distribution of Number of NBA Finals appearances (Blue) and Number of NBA Finals players (Red) by Draft Position.
We see that the first and fifth picks get to the finals more often than other positions. But that is primarily due to certain players such as Kevin Garnett (Fifth pick), Dwyane Wade (fifth pick), Tim Duncan (first pick), and LeBron James (first pick). We even See Kobe Bryant (13th pick) dramatically raise the number of NBA Finals appearances.
So instead we look at players. From this, we see that the most NBA Finals players come from the fourth and fifth picks with ten players each. The first and second picks then come in with nine players each. In fact, of the 81 players these four draft positions cover 38 of the 81 NBA finals appearances. We see a severe dip in NBA finals appearances starting with the sixth pick that never quite recovers above 6 players.
This suggests that picks one through five are the most important picks of the draft.
So who are the key players?
While there have been 115 of these first through five draft picks since 1994; there are only a few great players in the league selected in these positions. Of the 23 possible years for a lottery pick to win an Most Valuable Player award, only 14 MVP’s have been lottery picks.
In fact, there have been only nine players from the draft lottery to win MVP. Obviously LeBron James has been MVP and is one of the nine. He has also won the award four times. The other eight players? Kevin Garnett, Allen Iverson, Kobe Bryant, Tim Duncan (twice), Dirk Nowitzki, Kevin Durant, Derrick Rose, and Steph Curry (twice).
Where do these nine players fall?
Four players are #1 picks: Iverson, Duncan, James, Rose.
One player is a #2 pick: Durant
One player is a #5 pick: Garnett
One player is a #7 pick: Curry
One player is a #9 pick: Nowitzki
One player is a #13 pick: Bryant
Where are the other nine MVP’s located? Well David Robinson won one in 1995. Michael Jordan and Karl Malone each won two in 96/98 and 97/99, respectively. Shaquille O’Neal won in 2000. There’s the first six. All are players before the modern lottery era.
The other two? Steve Nash. Not a lottery player from the 1996 draft. Note that this year’s MVP has yet to be announced, but will be either James Harden, Russell Westbrook, or Kawhi Leonard. This will be interesting as Leonard is not a lottery pick.
What this does show is that MVP’s tend to be lottery picks. Note that Robinson and O’Neal are lottery picks from a past-time. Jordan is a “lottery” number but selected before the invention of the lottery. Malone was not a lottery selection (13th against the then 7-team lottery system).
Thus, the adage is then, lottery picks will eventually get into the playoffs. The higher numbers (1-5) tend to get in more frequently, but the greats are few and far between.
This is nothing new!
So What Is New Here?
The NBA Draft has been excellent at finding players that are a good fit for teams to make playoff pushes or rebuild a team. Some are nearly surefire selections such as LeBron James, Kevin Garnett, and Kevin Durant. Some are woeful such as Greg Oden and Kwame Brown. Some are highly variable and scare off potential suitors such as Kobe Bryant and Steve Nash.
But what we have shown here is that while higher draft picks are more desirable, there’s effectively no difference in picks between numbers one through eleven. The challenge is finding the right player that fits the team’s goal: system, rebuild, etc. And then properly preparing that player for the limelight. We have also shown that while the MVP’s can be found in the first picks, but that it’s not necessarily the case. This year’s MVP is not going to be a #1 pick. #1 picks are not surefire ways to find an MVP.
More importantly, only 81 lottery picks since 1994 have made the NBA Finals. That’s exactly 26.21% of lottery players. This means based on raw numbers alone, there’s roughly a three-quarters chance of never making the NBA Finals.
One more thing…
You’ve seen a handful of the numbers here. Without even looking into the stats, it’s easy to see that the 1996 and 2003 draft classes are above and beyond the best in the past 25 years of the draft. However, it’s difficult to contend that the 2003 class is worse than the 1996. But I’ll let you all argue that…


Pingback: How NBA Draft Lottery Probabilities Are Constructed | Squared Statistics: Understanding Basketball Analytics
Pingback: Toronto Raptors: 4 potential pathways to a championship - The AllStar