When we measure the defensive impact of a player, typically the first arguments we make are the number of blocks and steals that player has obtained. We celebrate players like Dikembe Mutombo and Maurice Cheeks for their prowess in obtaining blocks (2nd all time) and steals (5th all time), respectively. In the latter case, a steal has total meaning: a player has forcefully taken away a possession from the opponent through a turnover.
On the other hand a block, while erasing a field goal attempt from a team, does not necessarily terminate the team’s possession. Instead, blocks serve more as an intimidation factor; with the possibility of terminating a possession. Blocks may serve as a valuable tool in controlling the paint on defense, but it still gives the opposition hope in scoring a basket. For instance, a team with a dominant rim-protecting shot blocker in the paint may be nearly ineffective against a long-range team such as Golden State or Houston. And if that shot blocker aims to get more “Oohs” and “aahs” from the crowd by sending field goal attempts into the stands; all that happens is the offense gets a designed out-of-bounds play. A second life if you will.
In this installment, we take a look at the blocked shot and how to make blocked shots count in the league.
Distribution By Team: Golden State… holy cow…
First, we take a look at the distribution of blocked shots for each team. Let’s start simple. First we consider the number of field goal attempts taken against each team and count the number of blocks obtained. This in turn gives us a block percentage.

The first thing that jumps out is that effectively every team is at about 4-6% when it comes to blocking their opponents attempts. There are two primary exceptions: San Antonio Spurs (7.00%) and Golden State Warriors (9.46%). The Golden State Warriors rate is incredibly high as most teams tend to settle about 5% over the course of the season.
In fact the top five blocking teams, with respect to rate, are (in order) Golden State (9.46), San Antonio (7.00), Milwaukee (6.76), Toronto (6.51), and Utah (6.39). It should be noted that blocks do not necessarily translate to wins as we see Memphis (6th) and Los Angeles Lakers (7th) creep into the top.

Yeah, there’s pretty much no correlation between blocks and wins.
So why don’t blocks translate to wins? One simple answer is that blocks happen so rarely as it is, roughly one out of every 15-20 field goal attempts for almost every team that the net difference in blocks between teams is typically 0-2 blocks a game. This translates to effectively 0 – 2 points a game in difference; as most teams score roughly 1.1 points per possession. Note that we don’t state 2.2 points a possession; and this is because many blocks do not terminate possessions.
However, how are blocks distributed on the court?
Spatial Distribution of Blocks
As blocks are considered missed field goal attempts, we are able to identify the location of every block on the court, thanks to shot charts. Let’s consider the leader: Golden State against their rival Houston Rockets.

Distribution of Golden State Warriors blocks through December 19th, 2017.
We see a healthy dose of blocks around the rim, but also an excessively healthy amount of blocks in the mid-range and the along the perimeter. For example, we note that there are 25 three point attempts blocked, along with another 20 in the mid-range. Combined, this is 45 blocks outside of the paint, for an estimated erasing or 115 points. Compare this to Houston…

Distribution of Houston Rockets blocks through December 19th, 2017.
…and we get a completely different story. Don’t let the image fool you, there’s four blocks beyond the perimeter. It just so happens two blocks were recorded in the exact same position. We find that Houston picks up another 13 blocks in the mid-range; which is slightly on par with Golden State. We see the force of Clint Capela in the post with his 51 blocks so far this season.
But what these comparisons show is that Houston is more willing to let three point field goals go unblocked. In fact, Golden State’s opponents have attempted 884 three point attempts against Houston’s opponents with 825 attempts. What this shows is that teams are willing to shoot at roughly the same rate and Houston is leaving these attempts less contested than their Warrior counter-parts.
This difference may be of two reasons:
1. Fouling is Not Worth It
The first is that, the team may run the risk of fouling more often and therefore tread lightly on contesting three point attempts. Foul trouble plus, giving up 3+ points on a field goal attempt is one of the worst policies to have as a team on defense.
2. DEF 3PFG% Is Random
Second, Houston acknowledges that three point field goal percentage is roughly random. Every team defense gives up between 9-12 threes a game. While the difference is nine points, the 3FG% ranges between 34% and 40%. Which means there’s maybe one lost attempt a game; and the other couple attempts turn into two-point field goal attempts. Ultimately, why gamble on blocking three’s when unblocked three’s could lead to only a 1-2 points discrepancy overall. Instead, hard contests that force the player to put the ball on the floor possibly lead to a two-point FGA instead, and shave that 1-2 points over three possessions.
Whatever the reason, Houston is not taking away the points by blocking long range shots; while Golden State is. And this may become a difference maker should these two teams meet later on in the playoffs.
Splitting Blocks: 2FGA and 3FGA
Let’s take a moment to look into the distribution of blocks across two-point and three-point FGA.

And this is where Golden State really starts to separate themselves; if they haven’t already. Notice that every 8 two-point attempts against the Warriors results in a blocked shot. Similarly, every 35 three-point attempts results in a blocked shot.
For two-point FGA, the San Antonio Spurs come in second with a relatively meager one block per 10 two-point attempts. For three-point FGA, the Portland Trail Blazers clock in second with one block for every 84 attempts!
So how are the Warriors doing this? Two primary reasons:
1. The Warriors have Length
The very same reason why San Antonio is second, and Milwaukee creeps up in the list. These teams are armed with Stretch Armstrong-like reaches and give shooters the false sense of security when they see their defender 6+ feet away. Due to their reaches, the close-out requires less time; thus allowing the probability of a block to go up.
2. The Warriors Rotate Well
One of the best attributes of the Warriors is their ability to guard almost all positions at all times. The main (but not only) exception is when Stephen Curry is forced to guard a skilled post player. However, players such as Draymond Green, Kevin Durant, Andre Iguodala, Shaun Livingston, Klay Thompson, and the emerging rookie Jordan Bell can guard every position on the court. This allows them to make screen-and-rolls ineffective as they can merely switch with pre-switch, hedge capability.
The question is, do they really make their blocks count?
Making the Block Count
In order to “make a block count,” the result should not only take away a potential FGM; but also eliminate the team’s possession. In this case, we are interested more in what happens immediately after a block.
So let’s say first things first: we must find the block. Trawling through play-by-play logs, we can extract out every block in every game. Directory walking through the files, we take each game as a csv dump and extract out our blocks, tossing a block token down, called blockHappened. Clever name, I know!

Python code to extract blocks and begin a counting regimen.
Notice I split out every block into a dictionary that identifies the player, their team, and a sequence of six counters. The first counter is two-point FGA blocked. The second counter is three-point FGA blocked. The remainder? That’s what happens next…

Python code to count results after the block. ReverseDict checks a description box to look for Jump Balls and Team Rebounds.
The next step is to identify the action after a block. Typically, a block results in a rebound as it is a missed FGA. However, this is not always the case. It also happens that the shot clock expires before a player is able to obtain the rebound. This actually happens very rarely: only 6 times so far this season (out of 450 games).
Pop Quiz, Hot Shot:
Fun fact… some blocked shots result in jump balls. In this case, the possession terminates if the offense loses the jump. The result of the jump ball? It’s labeled a team rebound. These are lumped back into rebounds lost and won.
This means the third counter is the number of possessions terminated due to rebound. The fourth counter is the number of blocks that return to the hands of the offense. And the fifth counter is the number of blocks that turn into shot clock violations.
Finally, the last counter? That’s the other bin. With play-by-play data, we tend to get a handful of awkward recordings. No data is perfect, and watching blocks illustrates this mantra well. Out out the 4305 blocks, a total of 48 blocks resulted in random, nonsensical responses. For instance, some blocks resulted in substitutions. Some blocks resulted in a secondary missed three point attempt by Trevor Ariza; or an Enes Kanter put-back (without a rebound recorded). Some blockes resulted in steals for Larry Nance Jr. Oddities. This chalks up to missing play-by-play actions. So in this case, we assume these 48 instances are noise and just deal with it.
Who Makes Them Count?
As we walked through how to make blocks count, we now present the results for the Golden State Warriors.

Kills: Number of Possessions Terminated due to Defensive Rebound off a Block.
Here we see the team’s breakdown of blocks. Draymond Green is the beast of the team, recording seven blocks from beyond the arc. Similarly, David West and Kevin Durant have picked up four blocks from the perimeter. These numbers, while seeming low, are staggeringly high; seeing as multiple teams have only one block at the perimeter.
However, do they make the blocks count? Notice that half of Green’s blocks return to the hands of the offense. It’s actually one of the worst rates in the league for players with 20 or more blocks in the season. Breaking this down there are only 10 players with worse kill rates than Draymond Green. On the flip side, there are 58 players with better kill rates than Draymond Green. Note that there are four players tied with Green for kill rate. This places Draymond Green in the 15th percentile for making blocks count.
What this indicates is that while Green is skilled at obtaining blocks, he is not making them count as much as he should. Compare this to Jordan Bell, who has a possession kill rate of 74.07% on blocks, and we see that not only does Bell pick up blocks; but he makes them count.
Which Team Has the Best Kill Rates?
By taking a look a the kill rates for each team, we find that the Chicago Bulls actually have the best rates of converting blocks into offensive possessions. While they are the tops, they do not get many blocks. Therefore, this suggests their kill rate is ineffective. Think of this as a free throw shooter who has a .875 FT% because they are 7-for-8. Sure, they have a great percentage, but they aren’t scoring points. The same phenomenon applies here.
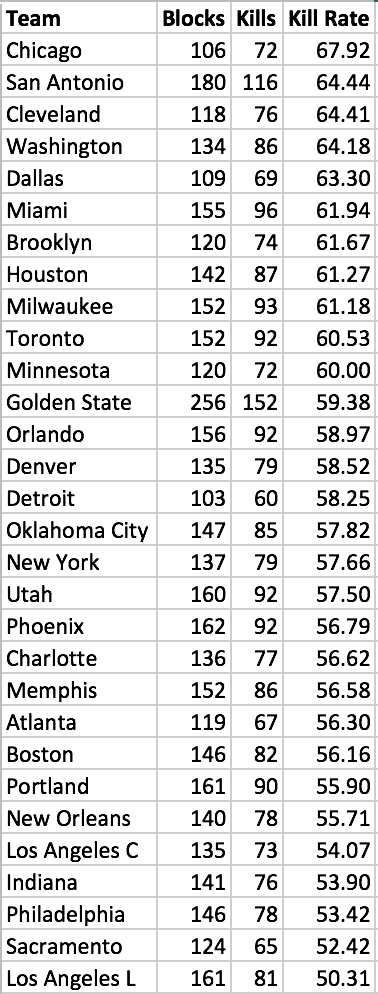
Instead, we look for teams with high kill rates and high total blocks. These teams are now making blocks look like steals and getting the desired return: points-less possessions for opponents. So how do we determine such teams? We look at the blocks versus kills plot.

We can start drawing contours on this plot to start sectioning teams off. Ideally, rates stay high as the blocks go up, so teams in the upper right corner of this plot are ideal. Well… there’s no teams there.
So instead, we start cutting the region with diagonal lines. Doing this, we find that the Golden State Warriors are still the top team; even when adjusting for possession counts (Note: block totals are impacted by possessions). After this, the San Antonio Spurs are a close second.
The third best team? Miami, who is in close contention with Washington.
Using the kill rates, we start to see the impact of blocks on the game and start to understand the player’s impact on the game. So while a player may accumulate many blocks, they may not be getting the same return as a steal; which, in the end, is what defenses are after: terminating possessions.
Below, feel free to scroll through all players in the league; distinguished by team.


Pingback: The Starting 5 | When Can We Trust A Team's Stats In The NBA
this blog is incredible, who are you??
LikeLike
Thanks! I’m Justin. 🙂
LikeLike
Great analysis, thanks!
There is also probably a degree of intimidation when shooting in front of teams/players that have a blocker reputation. I wouldn’t be surprised if some teams would shoot more rapidly, less efficiently or further away than usually when facing GSW or SAS.
LikeLike
this is amazing analysis. I was thinking that players who are considered shot blockers are very over valued commodities; mainly because the variance between elite shotblockers (2 plus blocks per game) and mediocre shot blockers (1 block per game) is so low. There are so many people on the “Mo Bamba hype train”. I think they are severely over estimating his value.
Thank you so much for breaking these numbers down. I will use them to respond to the Mo Bamba fan club.
Cheerio
LikeLike
Pingback: The “Wisconsin Stat” | Squared Statistics: Understanding Basketball Analytics
Pingback: Manifold Nonparametrics: Which Way Do Passers Pass? | Squared Statistics: Understanding Basketball Analytics
Pingback: Is Kevin Durant the Defensive Player of the Year? (2018) - San Francisco Sports Today
Pingback: Data From Deep: The Fischer effect (Part 1 of 3) – No Bid Nation
Fantastic content, I really love the in-depth look at blocking as it relates to statistics, especially when you used those images showing the distribution of blocks on the court.
LikeLike
Pingback: Blocks ≠ Good Defense – the high screener