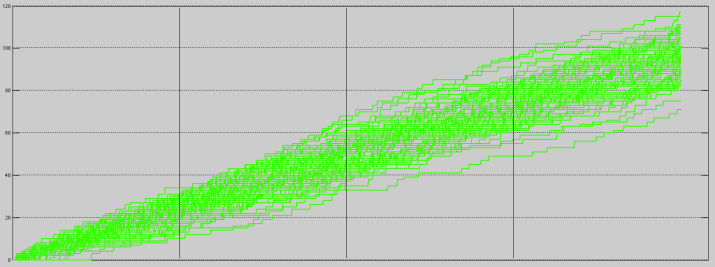
Almost every NBA game is played as a game of runs, with teams either piecing together five to ten point runs or going scoreless for a couple minutes at a time. To identify the scoring pace of a team, we can take a look at a simple measurement: the Score Flow. Score flows are popular tools to show fans how teams score throughout the course of a game. Score flows can also show basic trends in team play, such as whether a team is a let-down over the third quarter, or a team piles on the points at the end of quarters.
For instance, let us consider the Milwaukee Bucks 91 – 84 victory over the Miami Heat on November 16th, 2014 in Miami. In this game, the Milwaukee Bucks jumped out to an early six point lead over the first half of the first quarter before falling behind at the end of the quarter. The Heat rode the run through the second quarter, building a ten point lead before the Bucks started chipping away just before halftime. The Bucks regained the lead midway through the third quarter and, after a brief back and forth over a two minute period, controlled the fourth quarter using an early run. This description of the game is captured in the score flow. The question now is, “What can we do with these Score Flows?”
Let’s take a look at the Milwaukee Bucks’ Score Flows for all games in the 2014-15 NBA Season. The distribution of the Score Flows, with overtimes removed, give a basic idea of the Bucks’ pace of scoring throughout a game.
How do we compare the pace between two teams? To do this, we develop a statistical model on Score Flows by modeling the scoring over a given time period as a Poisson distribution. That is, we place a probability model on the number of points scored from the opening tip-off to the time in question. The Score Flow is just an illustration of a the number of points scored since the opening tip-off.
Treating a Score Flow as a series of observations from opening tip-off to the end of regulation, we are able to use the mean Score Flow; an averaged Poisson process. We can also put together a “95% confidence band” for the average Score Flow. An easy way to do this is to apply a point-wise confidence band; which leads to a Bonferroni set.

Average Score Flow (Black), with confidence bounds (Red), for the Milwaukee Bucks during the 2014-15 NBA season.
The confidence bounds reflect a Poisson distribution and aren’t the typical normal confidence bounds. If this were the normal confidence bands, we would be saying that it is possible to have negative points in a game. Taking a look at the first six minutes of every game for the Bucks over the 2014-15 NBA season, we see that the confidence bands never go into the negative direction.
Now we are able to compare two teams. Let’s consider the NBA Champion Golden State Warriors. The Warriors score a considerable more amount of points (110.0 ppg) than the Bucks (97.8 ppg) over the course of a game.

Score Flows (yellow) for the Golden State Warriors over the NBA 2014-15 Season. Average Score Flow (Black) and Confidence Bounds (Red) are given.
To compare the two teams on a minute by minute basis, we can measure the area between the curves. If a team dominates an opponent; that is, lead from wire to wire or develop large leads, then we expect that team to have the area in their favor. More directly, consider the difference calculated by subtracting the Bucks’ average Score Flow from the Warriors’ average.
Using the midpoint rule for integration, we get an approximate points led per game. This is obtained by finding the difference in points scored on average between the Bucks and Warriors per second, and finding the average points per second difference. This way, the Warriors tend to lead the Bucks by 6.81 points at any given point of the game.

Comparison of Average Score Flows for the Milwaukee Bucks (Green) and Golden State Warriors (Yellow) for the 2014-15 NBA Season. The Warriors are expected an average of a 6.81 point lead at any given moment.
It is seen that the tempo of the Warriors’ scoring is much quicker than that of the Bucks’ scoring. One advantage of Score Flows are that the processes are quick and cheap. They can be used to compare teams’ effectiveness between divisions, against specific opponents, or even as a function of days of rest.
More importantly, Score Flows give us a peek into the scoring rate of a team and how those teams spend their 2,880 seconds over the course of a game.


Hello, I enjoy reading all of your article. I wanted to write a little comment to support you.
LikeLike
really interesting
LikeLike